A Friday Crypto Snapshot Has More Than One Clock
A companion to the October 16, 2026 Majestify Pulse with Jabari and Zuri. The figures describe the episode’s frozen snapshot, whose observation dates differ. Research and education only, not financial advice.
Watch the matching conversation
Watch the October 16 Majestify Pulse on YouTube
Animation and host voices are AI-generated. Research and education only.
A dashboard can return a result now while describing a price path that ended yesterday. A Treasury series beside it can have another observation date. Even the service's status report can answer a different question from its successful calculation endpoint.
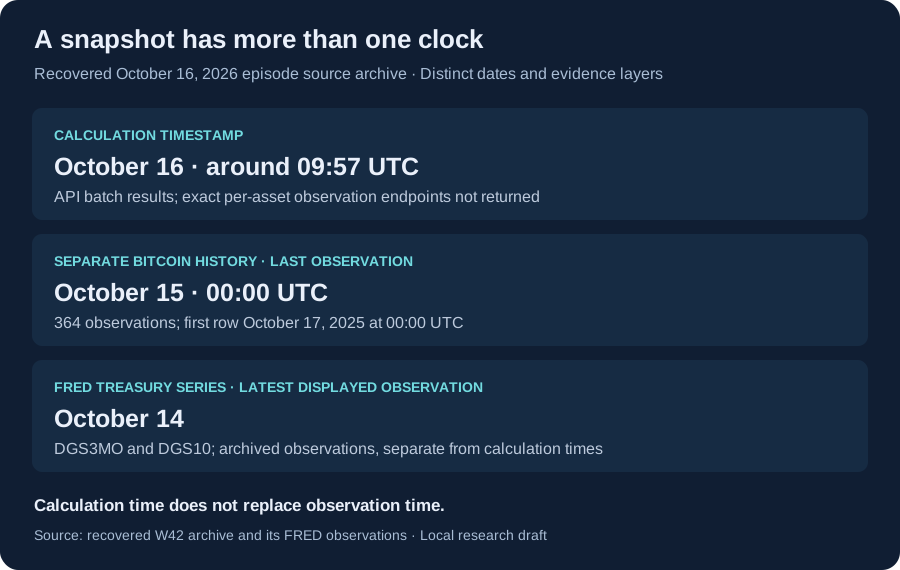
This week's small snapshot makes those distinctions concrete. The useful habit is to keep three clocks visible: when a response was retrieved, when a calculation was performed, and when its underlying observations occurred. A recent timestamp on one clock does not refresh the others.
Three takeaways for this week's reading
- Read the window before the percentage. A requested 30-day setting is not a seven-day weekly return, and the number of observations matters.
- Read the path beside the endpoint. A positive total return can coexist with a substantial decline from a previous peak within the sample.
- Keep successful responses and source assurance separate. A usable metric response does not establish that every provider or monitoring field is healthy.
What the asset response actually says
The episode’s frozen analysis files contain Bitcoin, Ethereum and Solana results under Majestify’s 30-day setting, with calculation timestamps around 09:57 UTC on October 16. Each result reports 30 price observations, 29 daily returns, CoinGecko API as its price source, and medium confidence. The table converts the returned decimal fractions into percentages and rounds them to two decimal places.
| Asset | API-reported compounded return | API-reported maximum drawdown |
|---|---|---|
| Bitcoin | +8.93% | 5.60% |
| Ethereum | +2.63% | 13.01% |
| Solana | +8.50% | 14.51% |
These are three selected assets from the episode’s archived 30-day analysis file, not a statement about the entire crypto market or a ranking for investment decisions. They describe the API's requested 30-day window, not this calendar week's performance. The batch response does not provide exact start and end timestamps for each asset, so that part of the comparison remains incomplete.
The return column summarizes endpoint growth. The drawdown column describes the largest decline from an earlier peak within the sampled path, a distinction discussed in Goldberg and Mahmoud's drawdown research. A positive endpoint result does not erase an intervening decline. Neither column forecasts the next move.
The figures above are explicitly API-reported. Rounding a response is different from independently validating its calculation or obtaining matching observations from another provider. Before treating a comparison as settled, preserve the raw response and check its definitions, inputs and date coverage.
The history clock is different from the calculation clock
The separate Bitcoin history supplied in the episode archive contains 364 timestamped observations, from October 17, 2025 through October 15, 2026 at 00:00 UTC. This longer history is a different input from the requested 30-day analysis. Its last observation is earlier than the calculation timestamps; those timestamps should not be read as new price observations.
This separate history also leaves quote currency, observation frequency and daily selection method unfilled. The timestamps can be inspected, but the missing labels should stay visible. We have not independently established the venue mix or price-selection convention behind those rows. The batch's exact date range is not proved merely by placing a separate history request beside it.
For a reusable chart caption, record the requested window, actual first and last observations, source, quote currency and sampling method. If a field is unavailable, say so. Readers can then decide whether two charts answer the same question before comparing their heights or headline percentages.
Treasury context carries its own date
The episode’s archived FRED series and macro snapshot use October 14 observations: 4.28% for the three-month constant-maturity Treasury yield and 5.19% for the ten-year yield. These are dated annualized market yields, quoted on an investment basis, with percent units and daily frequency. They are not October 16 observations or realized returns earned during this crypto sample. The three-month maturity also differs from a one-year crypto reporting window. See DGS3MO and DGS10.
The API analysis metadata names FRED DGS3MO public CSV as its risk-free source, without an explicit rate-value or observation-date field. The episode’s separate macro and board inputs carry 4.28%; that agreement is useful context, but does not supply the missing API input lineage. This article makes no rates-versus-crypto correlation claim, forecast or annual bill-earnings comparison.
A response can work while monitoring remains unresolved
The archived data-status snapshot reports unknown, with empty provider and latest-run maps. Its generated-at timestamp is 09:57:28 UTC, earlier than the asset results’ approximately 09:57:47 calculation times. Original HTTP fetch receipts are not included, and these separate artifacts do not establish a simultaneous system-wide state. The gap does not establish an outage; supplied metric results do not resolve it.
This distinction matters when describing a research tool. Preserve the observed result at each layer: the endpoint returned data; the response identified its source and confidence; some history labels were absent; provider-monitoring detail remained unknown. Combining those into a single claim that the data is fully verified or universally current would discard evidence readers need.
A short checklist before sharing a chart
- Identify the asset set and avoid extending a small sample to the whole market.
- Put observation dates next to retrieval and calculation times.
- State the window, units, provider, quote currency and missing metadata.
- Label API-reported, independently recomputed and hypothetical figures separately.
- Keep historical results separate from forecasts, recommendations and safety claims.
The practical takeaway is a better caption, not a trading signal. A useful snapshot says what was measured and when, then leaves its unresolved details visible. Which missing detail would most change your reading of a chart: its observation dates, quote currency, or sampling method?
Source note: this companion is bound to the recovered episode’s archive, extracted response files and shared source/claim manifest. Embedded calculation and generation times are preserved; original HTTP fetch receipts are absent. Public methodology and data-status responses may change.